Categories:
General Market Commentary
/
Precious Metals
Topics:
General Market Commentary
/
General Precious Metals
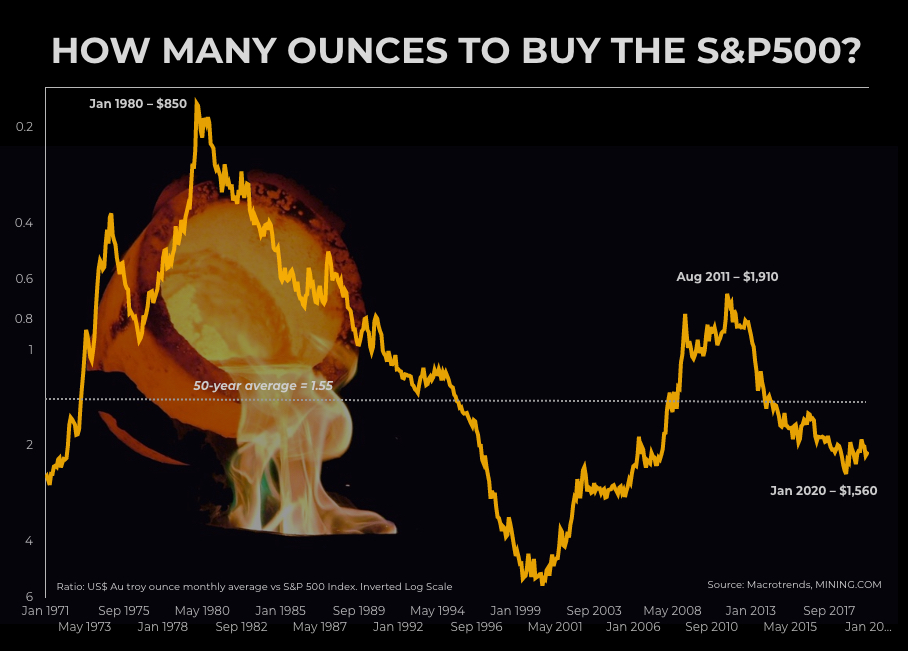
50-year chart shows how cheap gold price still is relative to stocks
The gold price was drifting sideways on Thursday, down some $50 an ounce from a brief (but glorious) near seven-year intraday high above $1,600 an ounce a fortnight ago.
But the metal remains firmly in a bull market with a 20%-plus rise over the past year. Go back 20 years, and the rally is even more spectacular considering at the turn of the century gold was trading for a relative pittance of $270 an ounce.
Is gold overvalued at these levels? Has the rise been too far, too fast? Are gold bugs (once again) guilty of irrational exuberance?
In comparison to stock markets, the answer is a resounding no. The gold price’s underperformance relative to the record–setting S&P 500 Index is stark.
Today, you need little over two ounces to buy the market. The ratio was the same in September 2007 when an ounce of gold could be picked up for less than $600.
The average over the long term – and we’re talking 90-years here – is 1.31.
Since the US left the gold standard entirely in August 1971, it’s 1.55. That implies a fair value for gold north of $2,400 an ounce, which either means gold bugs’ party has only begun or stocks are in for a real beating.